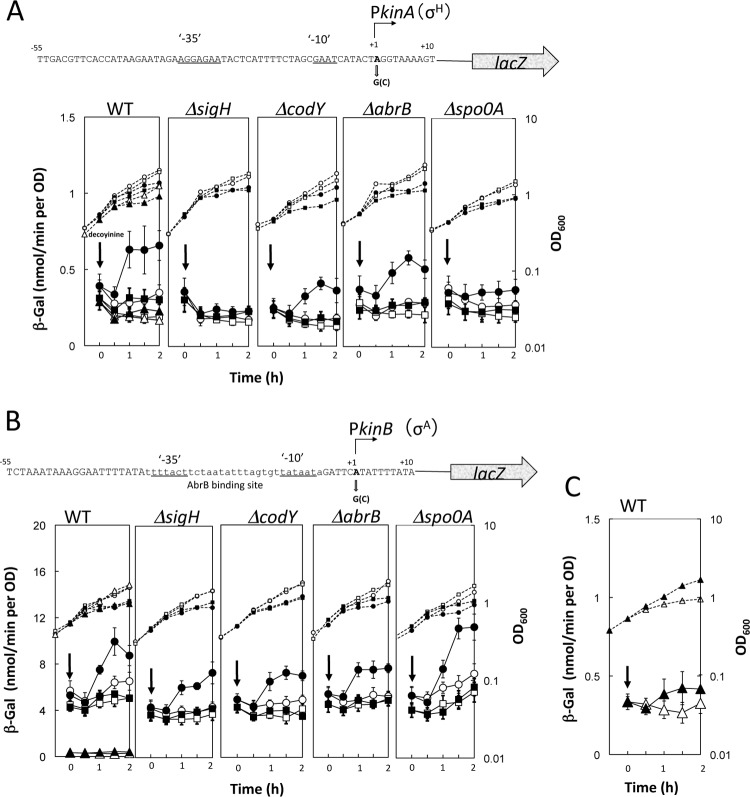
Fig 3.
Activation of the kinA and kinB core promoters upon addition of decoyinine. (A) The nucleotide sequence of the core kinA promoter region (nucleotides −55 to +10) is shown in the upper part, along with the transcription initiation adenine (boldfaced A at nucleotide +1) and the −10 and −35 regions that are recognized by RNAP possessing σH (30). This promoter region was transcriptionally fused with lacZ. The adenine at nucleotide +1 was replaced with a guanine. The synthesis of β-Gal encoded by lacZ under the control of the wild-type and guanine substitution kinA promoters was monitored after the addition of decoyinine in the wild-type (WT), ΔsigH, ΔcodY, ΔabrB, and Δspo0A backgrounds. Closed and open symbols indicate the presence and absence of decoyinine addition; circles, squares, and triangles represent the kinA promoters possessing adenine, guanine, and cytosine at nucleotide +1, respectively. Large and small symbols denote β-Gal activity and OD600, respectively. (B) The nucleotide sequence of the core kinB promoter region (nucleotides −55 to +10) is shown, along with the transcription initiation adenine (boldfaced A at nucleotide +1) and the −10 and −35 regions (underlined) that are most likely recognized by RNAP possessing σA (31). This promoter region containing the AbrB binding site (lowercase letters) (13) was fused with lacZ, whose transcription initiation adenine was replaced with guanine. β-Gal synthesis under the control of the WT and guanine substitution kinA promoters was monitored after the addition of decoyinine in the WT, ΔsigH, ΔcodY, ΔabrB, and Δspo0A backgrounds. The symbol assignment is the same as in panel A. (C) β-Gal synthesis under the control of the WT and cytosine substitution kinB promoter was monitored after the addition of decoyinine in the WT, where a scale of the vertical axis (WT in panel B) for the β-Gal synthesis is enlarged to the maximal value of 1.5. In all panels, the standard deviations of the average β-Gal activity values from the duplicated or triplicate experiments are shown by error bars. Thick and thin error bars are used for the adenine and guanine at nucleotide +1 of kinA and kinB (A and B), respectively. The error bars for the cytosine at nucleotide +1 of kinA and kinB are not shown in panel A or B (WT) to avoid unnecessary complication, but they are shown in panel C.

