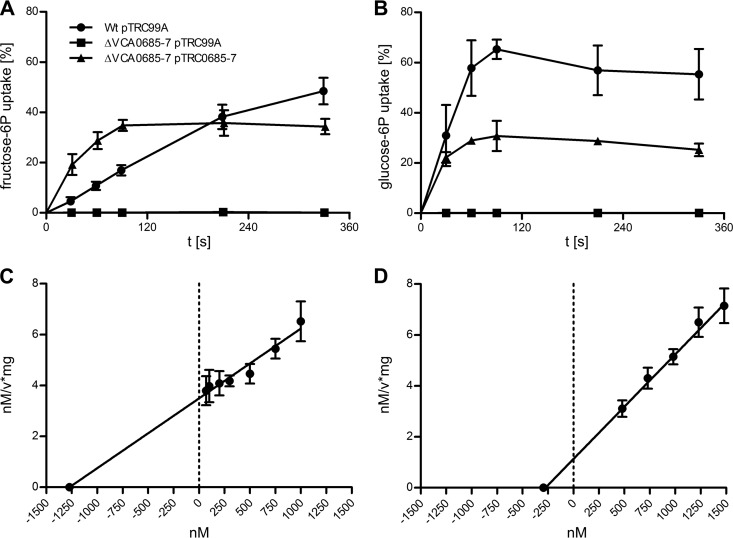
Fig 3.
Hexose-6P uptake by V. cholerae WT and mutant strains. The time-dependent uptake of [U-14C]d-fructose-6P (A) and [U-14C]d-glucose-6P (B) by the WT/pTRC99A strain and the ΔVCA0685-7/pTRC99A and ΔVCA0685-7/pTRC0685-7 mutant strains was determined as a percentage of the total added radioactivity. Shown are mean values of at least four independent measurements. The error bars indicate standard deviations. (C, D) The uptake velocities at specific substrate concentrations were determined by measurements at three consecutive time points. Shown are mean values of at least two independent experiments. The error bars indicate standard deviations. From Hanes-Woolf plots, the calculated apparent Km was 1.273 μM with a Vmax of 364.5 nM/min/mg protein for fructose-6P (C). As shown in plot D, the apparent Km was 0.275 μM with a Vmax of 243.4 nM/min/mg protein for glucose-6P.

