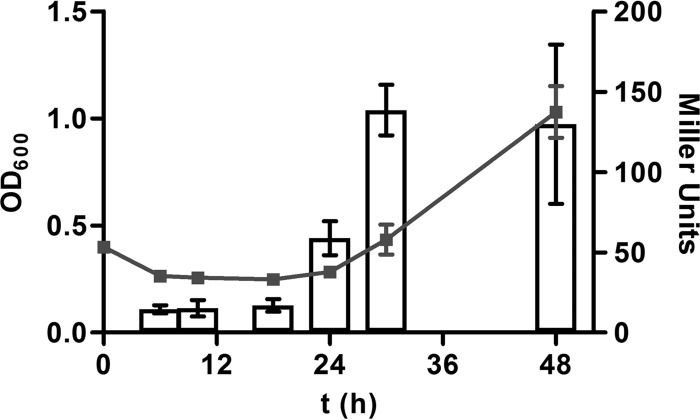
Fig 6.
uhp gene expression of VCA0687::phoA fusion activity along the growth curve. Shown are the mean values and standard deviations of four independent growth curves (OD600, left y axis) of VCA0687::phoA in M9 glucose-6P measured at 6, 10, 18, 24, 30, and 48 h. At the same time points and from these cultures, PhoA activities (in Miller Units, right y axis) of VCA0687::phoA were determined; mean values and standard deviations are shown.

