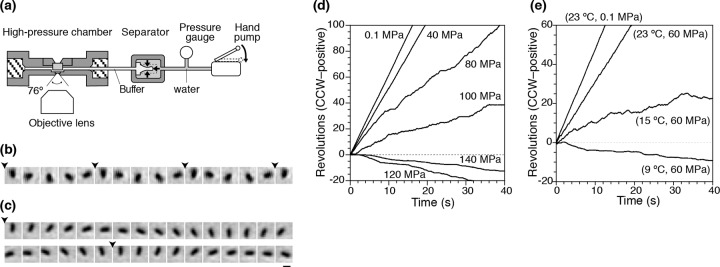
Fig 1.

Rotation of flagellar motors at high pressure. (a) High-pressure microscopy device (not to scale). (b and c) Sequential phase-contrast images of the same tethered cell at 33-ms intervals. The pressures were 0.1 (b) and 120 (c) MPa. The arrowheads indicate completion of a turn. Bar, 2 μm. (d and e) Time courses of rotations of individual cells (CCW positive). (d) The experimental temperature was 20°C, and the pressure was increased from 0.1 to 140 MPa. (e) Pressure was held at 60 MPa, and the temperature was decreased from 23 to 9°C.
