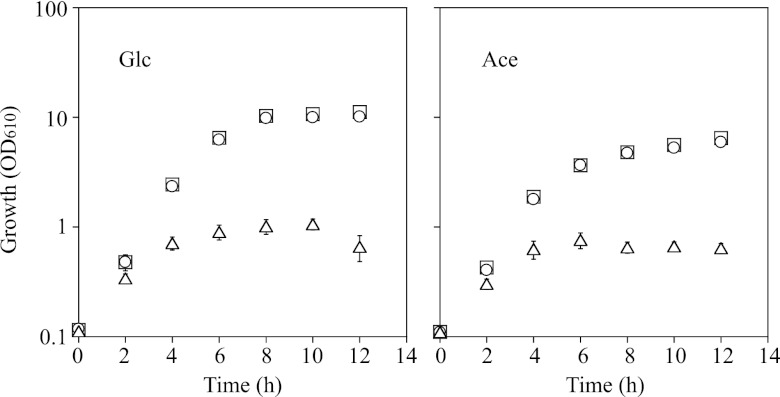
Fig 4.
Growth profiles of the ramA mutant carrying pCRC622 in A medium containing either 1% glucose (Glc) or 1% acetate (Ace) without (squares) or with IPTG. IPTG was added either 0 h (triangles) or 4 h (circles) after the start of culture. Mean values obtained from at least three independent cultivations are shown with standard deviations. OD610, optical density at 610 nm.

