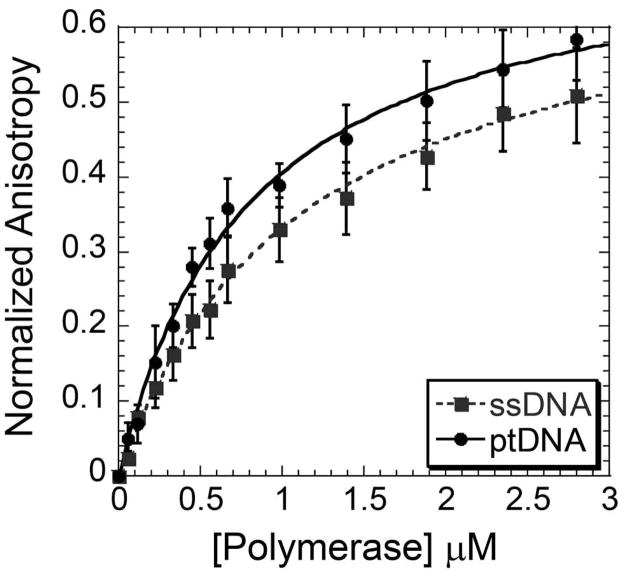
Figure 5.
Change in fluorescence anisotropy upon Dpo3 (D236A) binding to either Cy3-labeled ssDNA (Cy3DNA) (grey, dash) or ptDNA (black, solid). Data points were fit to Equation 4 to extract a Kd of binding for ssDNA (1.10 ± 0.08 μM) and ptDNA (0.81 ± 0.06 μM). The error bars represent the standard error from at least three independent experiments.

