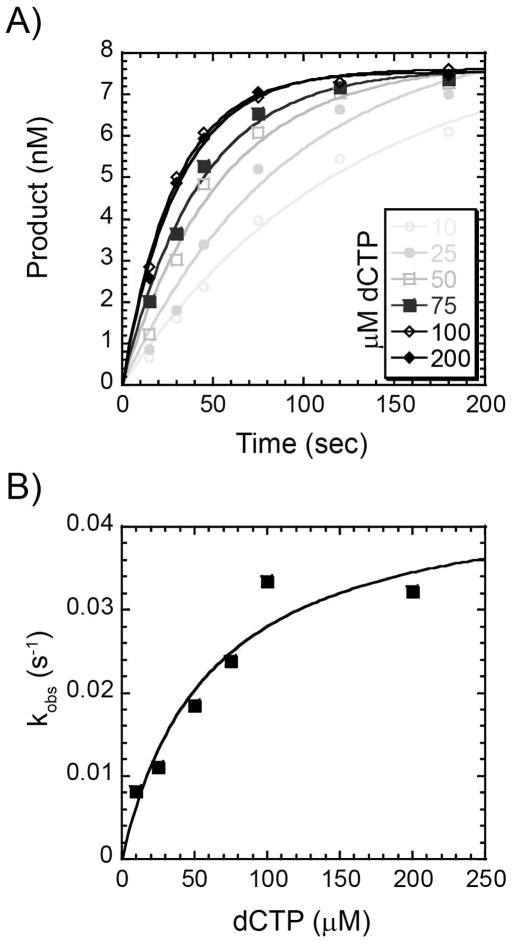
Figure 6.
Concentration dependence of the pre-steady state rate of correct nucleotide incorporation. (A) A preincubated solution containing 2 μM Dpo3 and Template G (9.6 nM) was mixed with increasing concentrations of dCTP (10 μM – 200 μM) for the indicated time points. The data was fit to Equation 3 to determine the single-exponential rate (kobs). (B) kobs values were plotted as a function of dCTP concentration and fit with Equation 4 to yield kp (0.045 ± 0.008 s−1) and Kd (61 ± 26 μM).

