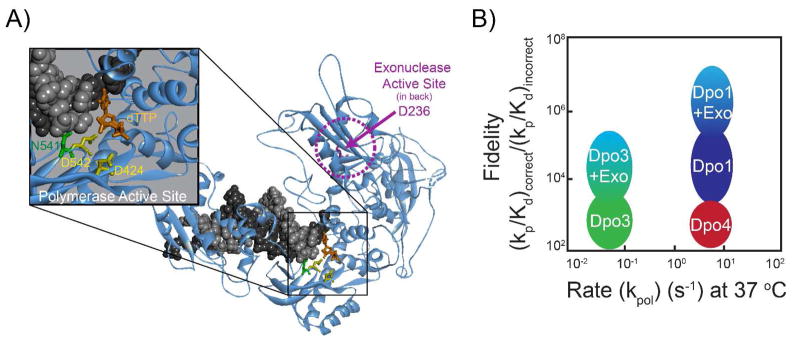
Figure 8.

A) Homology model of the ternary complex of Dpo3 bound to DNA (black/grey) with incoming dTTP (orange) highlighting the aspartates in the polymerase (D424 and D542, yellow) and exonuclease (D236, pink) active sites. N541 (green) is also shown orientated towards the minor groove of the dsDNA template. B) Graphical representation of the fidelity [(kp/Kd)correct/(kp/Kd)incorrect] as a function of the rate (kpol) comparing Dpo1, Dpo3, and Dpo4.
