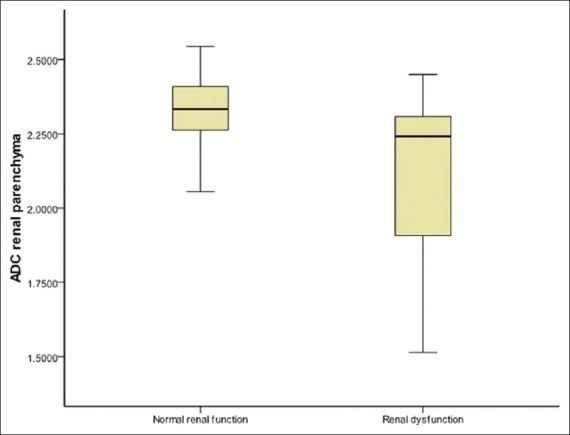
Figure 1.

Box-and-whisker plot of renal parenchymal ADC in patients with renal dysfunction and those with normal renal function showing lower ADC values associated with renal dysfunction. The lines within boxes represent median value. The top and bottom of boxes (hinges) represent the 25th and 75th percentiles of the data values. The T-bars that extend from the boxes (whiskers) are expected to include approximately 95% of the data (assuming normal distribution)
