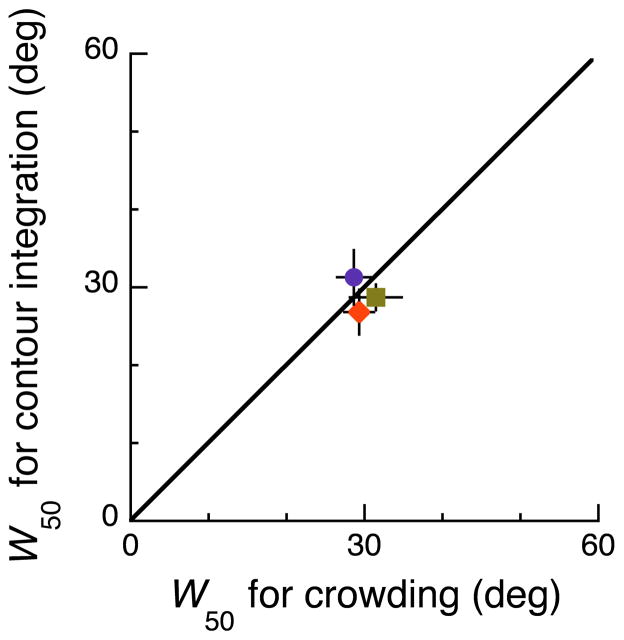
Figure 5. Scatter plot of wiggle thresholds.
Each point is the wiggle threshold W50 in the contour-integration task versus that in the crowding task. As predicted, the wiggle threshold is about 30 deg and the data points all lie practically on the line of equality. For each observer, we obtain four independent wiggle thresholds in the letter identification task and plot the mean (observer SBR orange diamond; LH green square; CRK purple circle). For each observer, we obtain two independent wiggle thresholds for the phase discrimination task and plot the mean. Error bars are mean ± standard error.

