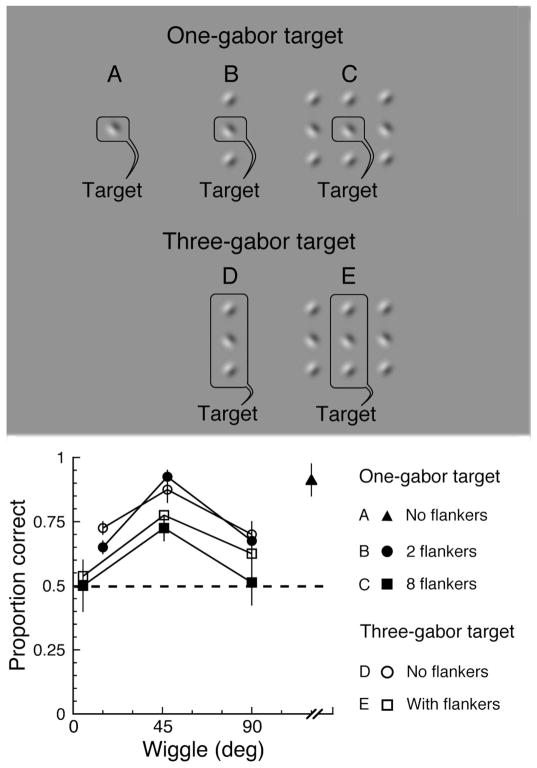
Figure 6. Crowding is unaffected by the spatial extent of the task-related information.
The top panel displays the stimuli, which are presented in the periphery, 10 deg to the right of fixation. A: a single unflanked target gabor. B: a target gabor flanked by gabors, above and below, forming a vertical line. C: a target gabor flanked by eight gabors, forming three vertical lines. D: three target gabors in a vertical line, unflanked by other gabors. E: three target gabors flanked by two vertical lines of gabors. On a given trial, all gabors in the stimulus have one of three orientations relative to the vertical, 0, 45 or 90 deg, with the direction of tilt alternating between adjacent gabors. We add a small orientation jitter to each gabor, randomly chosen from a uniform distribution between -5 and 5 deg. The phase of each target gabor is random (ψ = 0 or 180 deg) on each trial. The non-target gabors have a phase of 0 deg. The wiggle is measured by the procedure described in Methods. For each configuration and wiggle, we present 40 trials. The stimulus is displayed for 150 ms. In both one-gabor-target and three-gabor-target conditions, after each trial, two response alternatives are presented on the screen. One is identical to the target and the other is a foil, identical to the target except that the phase of each gabor is random (0 or 180 deg), with the proviso that the foil is never wholly identical to the target. (The phase of more than one gabor can differ between target and foil when the target consists of several gabors.) The observer is asked to pick the alternative that matches the target. The bottom panel plots the (average) results of two observers. Performance in all conditions peaks at intermediate wiggles and declines at both higher and lower wiggles, just as observed in the main experiment. Chance performance (50%) is indicated by the dashed line. Error bars are mean ± standard error.
To test whether there is an effect of the area occupied by the task-related information, we compare performance across the two main conditions (single- versus three-gabor target) in the cases that display the same number of gabors on the screen, i.e. B versus D (solid versus open circles) and C versus E (solid versus open squares). At each wiggle, performance is similar in these two conditions, showing no effect of tripling the number of gabors (and area) containing task-relevant information.

