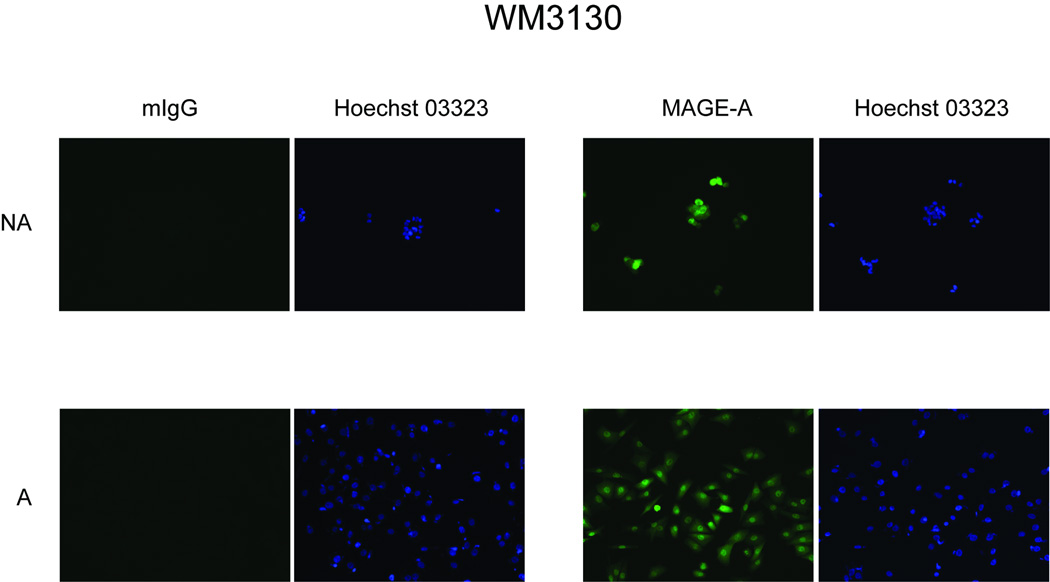
Figure 2. Immunofluorescence analysis of MAGE-A antigens expression in NA and A WM3130 melanoma cells.
NA and A WM3130 cells were fixed in 4% paraformaldehyde, blocked in 1:50 fold dilution of goat serum in 1× PBS/0.1% Triton-X 100, and incubated with the anti-MAGE-A mAb clone 6C1 or with mouse IgG (mIgG), as a control. After washing, cells were incubated with goat anti-mouse Alexafluor 488 secondary antibody, and nuclei were stained with Hoechst 03323. Photographs were taken at 20× magnification.

