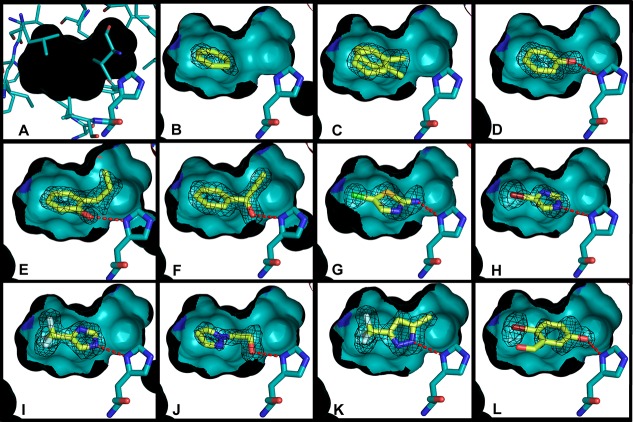
Figure 2.
Crystallographic poses of the L99A/M102H† ligands newly reported here. In all cases, oxygens are represented in red, nitrogens blue, and sulfurs yellow. A cutaway of the crystallographically determined protein structure (and surface) is shown with cyan carbons, and the crystallographically determined ligand carbons are light yellow. The side of the surface occupied entirely by the protein is in black. His102 and the ligands are shown in a stick representation. Hydrogen bonds between the ligand and His102 are shown with red dashes. The Fo – Fc electron density map of the protein after refinement but before placement of the ligand is shown in black mesh at σ = 3.0. The figure was rendered with PyMol.70 (A) L99A/M102H† internal cavity showing the protein residues that make up the internal surface of the cavity in a thin stick reperesntation (other than His102). In all cases, the ligand binding cavity is completely physically isolated from bulk solvent. (B) L99A/M102H† with benzene bound, (C) L99A/M102H† with toluene bound, (D) L99A/M102H† with phenol bound (hydrogen bond distance = 2.86 Å), (E) L99A/M102H† with 2-allyl phenol bound (hydrogen bond distance = 3.00 Å), (F) L99A/M102H† with 1-phenyl-2-propyn-1-ol bound (hydrogen bond distance = 2.77 Å), (G) L99A/M102H† with 2-amino-5-chloro thiazole bound (hydrogen bond distance = 2.89 Å), (H) L99A/M102H† with 4-bromoimidazole bound (hydrogen bond distance = 2.93 Å), (I) L99A/M102H† with 4-trifluoromethyl imidazole bound (hydrogen bond distance =2.85 Å), (J) L99A/M102H† with 2-(pyrazolo-1-yl) ethanol bound (hydrogen bond distance = 2.77 Å), (K) L99A/M102H† with 3-trifluoromethyl-5-methyl pyrazole bound (hydrogen bond distance = 2.90 Å), (L) L99A/M102H† with 2-bromo-5-hydroxybenzaldehyde bound (hydrogen bond distance = 2.50 Å).

