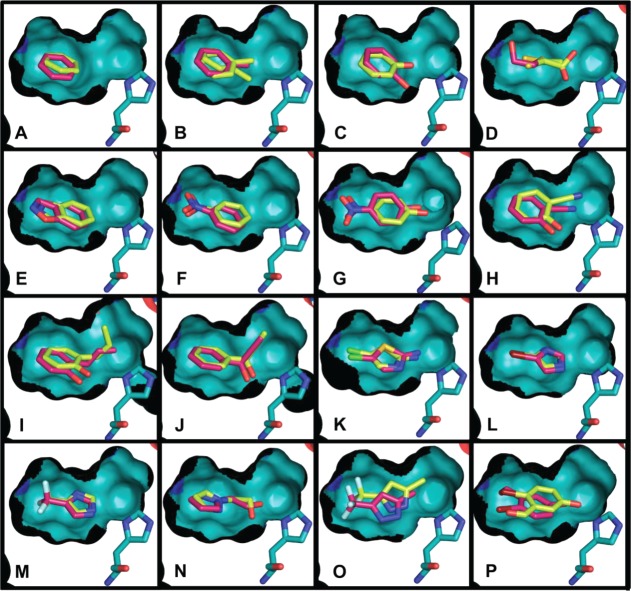
Figure 4.
Comparison of the crystallographic (carbons light yellow) and docking-predicted poses (carbons magenta) of the L99A/M102H† ligands showing a cutaway of the surface of the cavity (otherwise colored as in Figure 1); His102 is shown. The figure was rendered with PyMol.70 In all cases, the cavity is buried from bulk solvent, and only small changes in the binding site were observed among the different structures. Values for RMSD between the docking poses and the crystallographic ligand geometries are given in Table 3. Shown are the complexes with (A) benzene, (B) toluene, (C) phenol, (D) 2-mercaptoethanol (PDB ID 4E97(37)), (E) 1,2-benzisoxazole (PDB ID 4EKS(37)), (F) nitrobenzene (PDB ID 4EKP(37)), (G) 4-nitrophenol (PDB ID 4EKQ(37)), (H) 2-hydroxy benzonitrile (PDB ID 4EKR(37)), (I)) 2-allyl phenol, (J) 1-phenyl-2-propyn-1-ol, (K) 2-amino-5-chloro thiazole, (L) 4-bromoimidazole, (M) 4-trifluoromethyl imidazole, (N) 2-(pyrazolo-1-yl) ethanol, (O) 3-trifluoromethyl-5-methyl pyrazole, (P) 2-bromo-5-hydroxybenzaldehyde.

