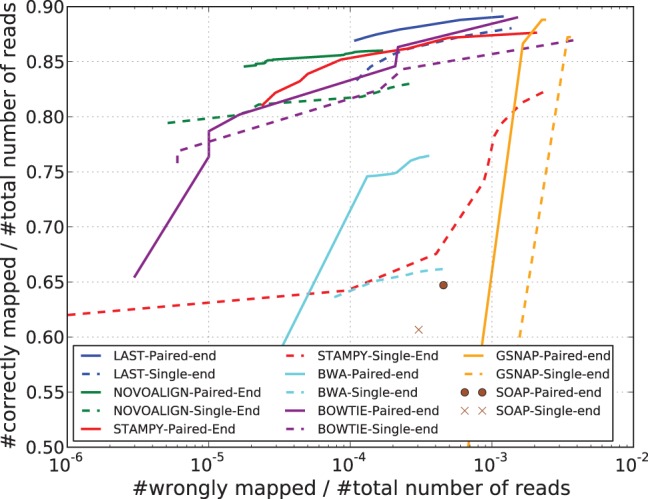
Fig. 1.

Paired-end versus single-end mode. Comparing the results of mapping the same set of simulated 100 bp-long human reads with the human reference genome hg19, in paired-end mode (solid lines) and single-end mode (dashed lines). The caption of Figure 3 describes how the lines in the plot above are computed. Details of the simulation process are provided in Section 3.1
