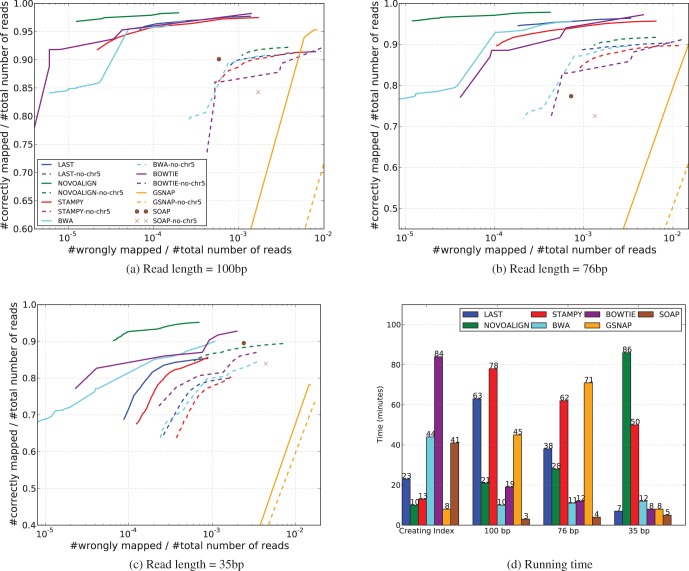
Fig. 3.
(a–c) The result of mapping 1 million pairs of simulated short reads of various lengths to Chromosomes 1–22 and X of hg19, respectively. Most aligners assign to each reported alignment a mapping quality score, which reflects the aligner’s estimate of the probability that the alignment is incorrect. Although Last reports raw probability values, some aligners like BWA and Bowtie apply phred-like scaling to obtain discretized integer scores. In either case, the mapping results from an aligner can be filtered to obtain only those alignments that pass a certain mapping quality threshold. Each curve in the plots above is obtained from connecting discrete points, each point corresponding to the fraction of wrongly mapped and the fraction of correctly mapped reads at a certain mapping quality threshold. When varying the mapping quality threshold, we were careful not to go below the mismap probability of 0.5. As it is not possible to have more than one alignment with mismap probability <0.5, this avoids the complications of having to evaluate cases of multiple/secondary mappings. Solid lines are for mapping reads to a complete reference, and dashed lines are for the test with reference with chromosome 5 missing. An exception is SOAP, which does not provide mapping quality values; therefore, it is represented by a single data point in each plot. (d) The running time for creating the index of the reference genome and the alignment time corresponding to the results of (a–c), when executed on a single core of a machine with Intel(R) Core(TM) i7-3770K CPU @ 3.50 GHz and 32 GB random access memory

