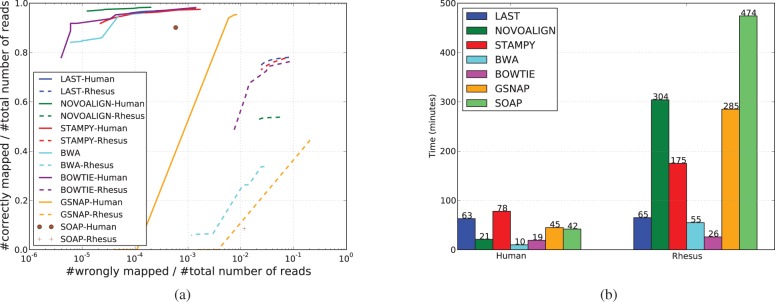
Fig. 4.

Xenomapping. (a) The result of mapping 1 million pairs of simulated human reads of length 100 bp to rheMac2 (dashed lines) compared with that of mapping the same reads to hg19 (solid lines). (b) The running time (excluding the genome indexing step) corresponding to the results of (a)
