
Fig. 1.
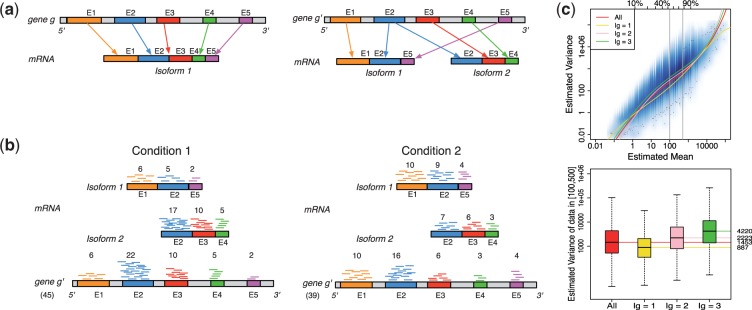
Panel (a) shows two hypothetical genes g and  . Gene g has one isoform, denoted by
  ; gene
  has two (
 ). The problem of estimating expression for isoforms of
  is complicated by the fact that reads mapping to exon 2 must be unambiguously assigned to each isoform. This results in increased uncertainty, on average, in expression estimates for isoforms sharing a parent. Panel (b) shows hypothetical expression of the isoforms from gene
  in each of two conditions (assuming differences in library size have been accommodated). If one focuses on the longest isoform (isoform 1) and uses all reads mapping to its constituent isoforms to estimate its expression, the isoform is called equivalently expressed, as there are 30 (6 + 22 + 2) reads mapped in condition 1 and 30 (10 + 16 + 4) mapped in condition 2. However, if the expression of other isoforms is considered, it becomes clear that isoform 1 contains almost twice as many reads in condition 2 as in condition 1 (23 versus 13, respectively). Panel (c) demonstrates how estimation uncertainty changes as isoform complexity increases. We quantified isoform complexity here by Ig where the
  group represents isoforms from genes with k isoforms (here isoforms from genes with more than three isoforms are included in the
  group; alternative definitions of complexity are discussed in the text). Shown top right are splines fit to the empirical variance as a function of the mean for all isoforms as well as isoforms within groups defined by Ig for the two-group human embryonic stem cell RNA-seq experiment described in Section 2; bottom right considers isoforms with average expression (expected count) in [100, 500]. The range was chosen as it approximates the 50th and 80th percentiles of expression across all isoforms. Shown are box plots of the variances of these isoforms collectively, and within Ig group. Median variance within each group is shown right