
Fig. 2.
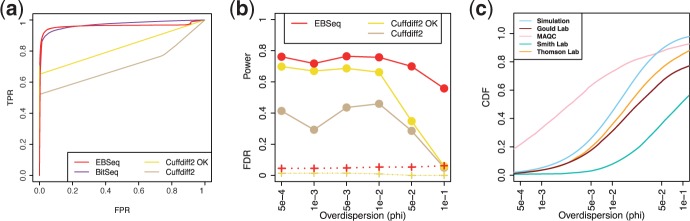
Panel (a) shows ROC curves (TPR versus FPR). The curves are obtained from averaging over 100 Sim I simulations. Cuffdiff2 deems some isoforms unacceptable prior to analysis; isoforms deemed acceptable by Cuffdiff2 are denoted ‘OK’; and results are reported here for both (see Section 2 for more details). Panel (b) shows the operating characteristics of EBSeq and Cuffdiff2 as a function of ϕ, described in Sim II. The solid and dashed lines indicate power (TPR) and FDR, respectively, at 5% target FDR. Note that BitSeq provides a PPLR for rank ordering isoforms, but does not detail how to use the PPLR scores to control FDR for two-sided test. Consequently, BitSeq is evaluated when ranking isoforms in Panel (a), but not when FDR-controlled lists are considered in Panel (b). Panel (c) shows the CDF of ϕ in four empirical datasets, detailed in Section 2 and the Supplementary Material, as well as the CDF averaged across 100 Sim I simulations