
Fig. 3.
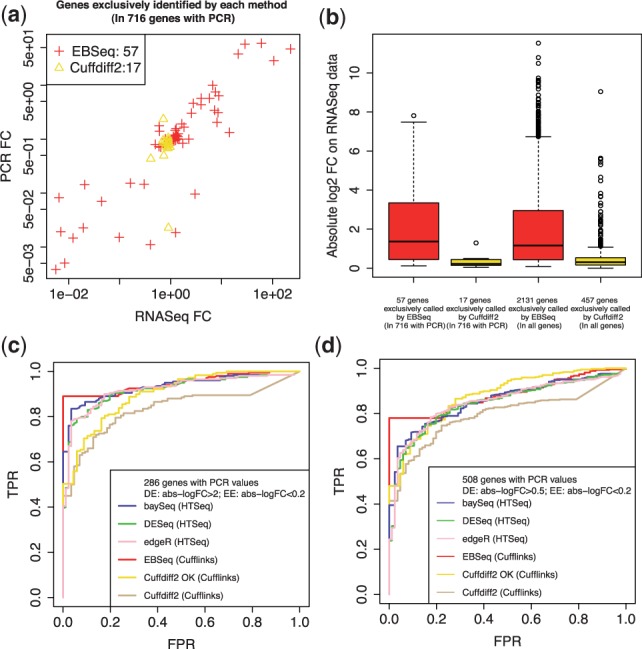
Panel (a) shows the fold changes (log2 scale) from RNA-seq versus PCR for the 57 genes identified by EBSeq but not Cuffdiff2 and the 17 genes identified by Cuffdiff2 but not EBSeq out of the 716 gold-standard genes from the MAQC dataset. Panel (b) shows box plots of the absolute value of RNA-seq fold changes (log2 scale) for the same 57 and 17 genes, as well as the 2131 and 457 genes identified exclusively by EBSeq and Cuffdiff2, respectively, in the full set of genes. Panel (c) shows ROC curves for baySeq, DESeq, edgeR, Cuffdiff2 and EBSeq. Cuffdiff2 and EBSeq are applied to gene expression estimated via Cufflinks. Results from EBSeq applied to gene expression counts derived from HTSeq are similar (data not shown). The ROC curves based on another threshold in Bullard et al. are shown in panel (d)