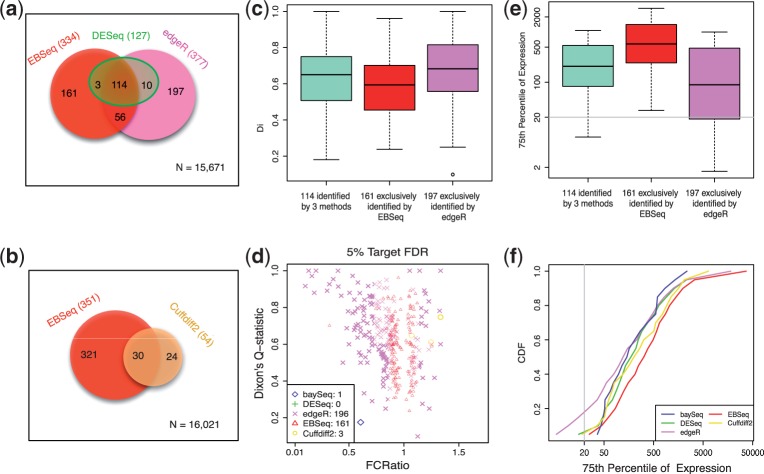
Fig. 4.
Results are shown for the human embryonic stem cell case study, which compares ESCs with iPSCs. Panel (a) shows a Venn diagram of the genes identified as DE by DESeq, edgeR or EBSeq using HTSeq for quantification. Panel (b) shows a Venn diagram of the genes identified by Cuffdiff2 and EBSeq using Cufflinks-processed data. Panel (c) shows box plots of Dixon’s Q-statistics in three groups of genes—the 114 identified by DESeq, edgeR and EBSeq; the 161 identified by EBSeq but not DESeq or edgeR; and the 196 identified by edgeR but not DESeq or EBSeq. Panel (d) shows the FCRatios and Dixon’s Q-statistics of the genes identified exclusively by each method, but not the other four methods (in this panel, five methods are compared). Note that baySeq, Cuffdiff2, DESeq, edgeR and EBseq (via HTSeq) identify 34, 54, 127, 377 and 334 DE genes, respectively, at 5% FDR. Panel (e) shows box plots of each gene’s 75th percentile of expression for the three groups of genes defined in panel (c). Panel (f) shows the CDF of the 75th percentile of expression among the 34, 54, 127, 377 and 334 DE genes identified by each method

