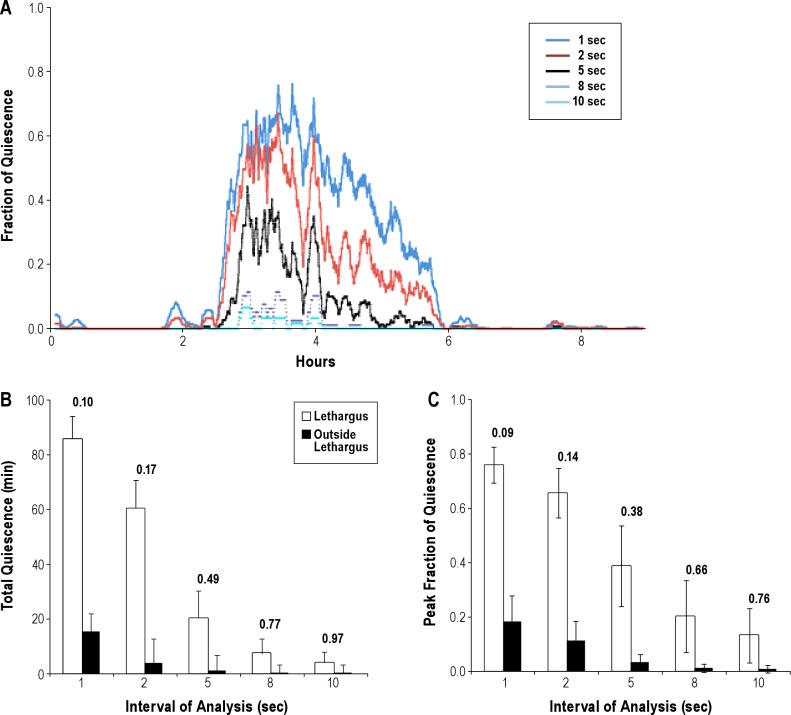
Figure 3.
The effect of interval of frame subtraction on quiescence. (A) Fraction of quiescence in a 10-min moving window of the data from the same worm analyzed at variable intervals of subtraction. (B) Mean total quiescence during lethargus and outside lethargus as a function of different subtraction intervals. Error bars denote standard deviation (SD). N = 19. Values above the bars are the coefficients of variation (CVs). (C) Mean peak fraction of quiescence during lethargus and outside lethargus as a function of different subtraction intervals. Error bars denote SD. N = 19. Values above the bars are the CVs.

