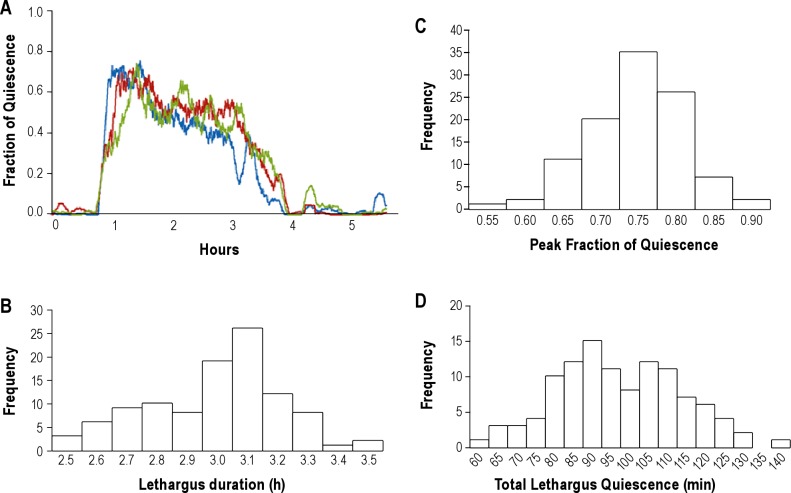
Figure 4.
Analysis of data from wild-type animals. (A) Fraction of quiescence in a 10-min moving window of 3 individual wild-type worms using a 1-sec interval of subtraction. The x-axis of the 3 traces was aligned so that the beginning of L4 lethargus was the same for the 3 traces. (B) Distribution of lethargus duration among 104 wild-type worms. The distribution did not deviate from normality (P > 0.05, Shapiro-Wilk Test, with Bonferroni post hoc correction).48 (C) Distribution of peak fraction of quiescence among 104 wild-type worms. The distribution did not deviate from normality (P > 0.05, Shapiro-Wilk Test, with Bonferroni post hoc correction). (D) Distribution of total quiescence in L4 lethargus among 104 wild-type worms. The distribution did not deviate from normality (P > 0.05, Shapiro-Wilk Test, with Bonferroni post hoc correction).

