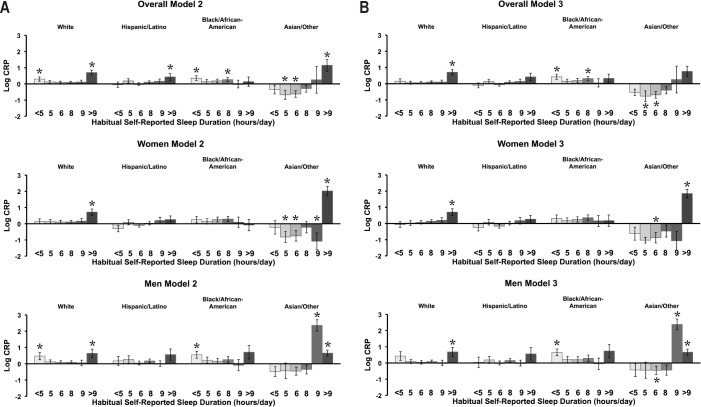
Figure 2.
Stratified results of sleep duration × race/ethnicity interactions for C-reactive protein (CRP). (A) Results for Model 2 (which includes age, sex, body mass index [BMI] and BMI2) are displayed for the complete sample (interaction P = 0.003), men (interaction P < 0.001), and women (interaction P < 0.001). (B) Results for Model 3 are presented for the complete sample (interaction P = 0.003), men (interaction P < 0.001), women (interaction P < 0.001). *P < 0.05 relative to 7 h. Error bars = SEM.

