
Figure 4. α1A-AR activation increases GABAergic inhibition on to MCs in the AOB and MOB.
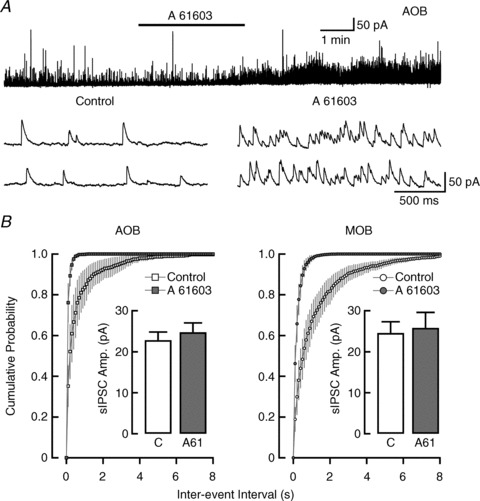
A, top trace: recording from an MC in the AOB, where sIPSC frequency was greatly increased by a low concentration of the α1A-AR selective agonist A 61603 (30 nm; control: 2.1 Hz, A 61603: 8.0 Hz). Bottom traces: representative sIPSCs pre-application (left) and post-application (right) of A 61603 from the above trace. B, average cumulative inter-event interval distributions of sIPSCs in MCs of the AOB (left) and MOB (right). Application of 1 μm A 61603 (filled squares and circles) produced a leftward shift from the control event distribution (open squares and circles) consistent with an increase in sIPSC frequency. Insets: the average sIPSC amplitude in A 61603 (grey bars) was not different from control conditions (white bars) in the AOB (n= 7) or MOB (n= 8). AOB, accessory olfactory bulb; MCs, mitral cells; MOB, main olfactory bulb; sIPSCs, spontaneous IPSCs.