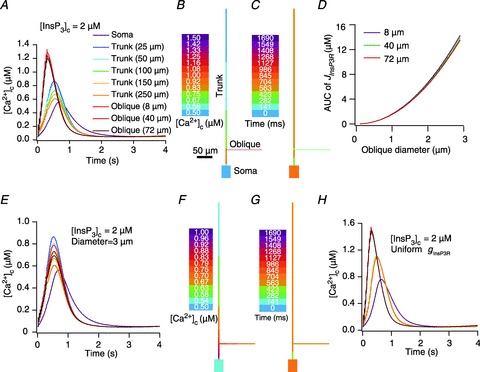
Figure 2. Sensitivity analyses of critical parameters that regulated calcium waves in a three-cylinder model neuron.

A, [Ca2+]c traces as a function of time for selected locations on the three-cylinder model when calcium waves were initiated by pairing 10 bAPs separated by 30 ms ISI with elevated [InsP3]c. B–C, shape plots of the model neuron depicting peak [Ca2+]c (B) and the time at which this peak occurred (C) along the neuronal topograph for the experiment depicted in A. D, area under the curve (AUC) for the flux of Ca2+ through InsP3R (JInsP3R), measured at different oblique dendritic locations, plotted as a function of the diameter of the oblique dendrite. E–G, as A–C, but simulations were performed with oblique diameter set at 3 μm. H, as A, but simulations were performed with uniform InsP3R density throughout the neuron. Location codes for E and H are the same as in A.
