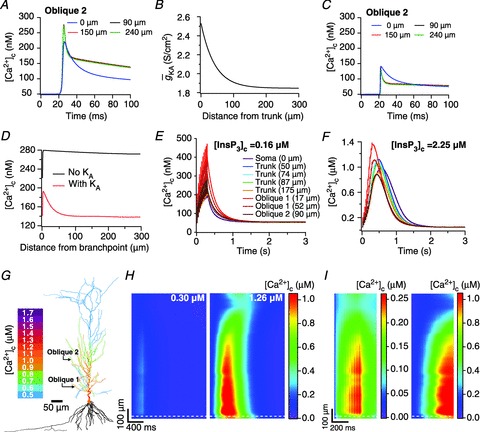
Figure 4. Calcium waves in a morphologically realistic neuronal model.

A, [Ca2+]c transients in response to a single backpropagating action potential at various locations in a proximal oblique (Oblique 2 in G), in the absence of A-type K+ channels. B, gradient in A-conductance required for normalizing [Ca2+]c transients across various locations in the oblique dendrite under consideration. C, as A, but in the presence of A-type K+ channels with a gradient shown in B. D, peak [Ca2+]c at different locations in the oblique 2 in the absence and in the presence of A-type K+ channels, quantified from experiments depicted in A and C, respectively. E, [Ca2+]c trace with baseline [InsP3]c (= 0.16 μm) at various locations in response to a train of 10 bAPs, separated regularly by 30 ms intervals. F, as E, but with elevated [InsP3]c (= 2.25 μm) to model bath application of group I mGluR agonists. Note differences in the peak [Ca2+]c with respect to E. For E and F, distances for trunk locations are radial distances from the soma. For locations on oblique dendrites, distances are path distances from their respective branch points on the trunk. G, shape plot of the model neuron showing peak [Ca2+]c along the neuronal topograph during the Ca2+ wave shown in F. Note that [Ca2+]c in basal dendrites is not shown, owing to lack of experimental data on basal dendrites in CA1 pyramidal neurons. H, kymographs showing time-dependent changes in the [Ca2+]c in response to a train of 10 bAPs, separated regularly by 30 ms intervals, under baseline (left) and elevated (right) InsP3 levels, derived from experiments depicted in E and F, respectively. The ordinate represents the path distance along the somato-dendritic axis (apical dendrites only) and the abscissa represents time. Numbers on the kymograph represent the highest peak value of [Ca2+]c measured across different locations on the somato-dendritic axis. I, as H, but the kymograph shows [Ca2+]c only for the first 500 ms. Note that the scales (presented to the right of each subpanel) are different for the left and the right subpanels. White dashed lines in H and I represent the border between the soma (below the line) and the apical trunk.
