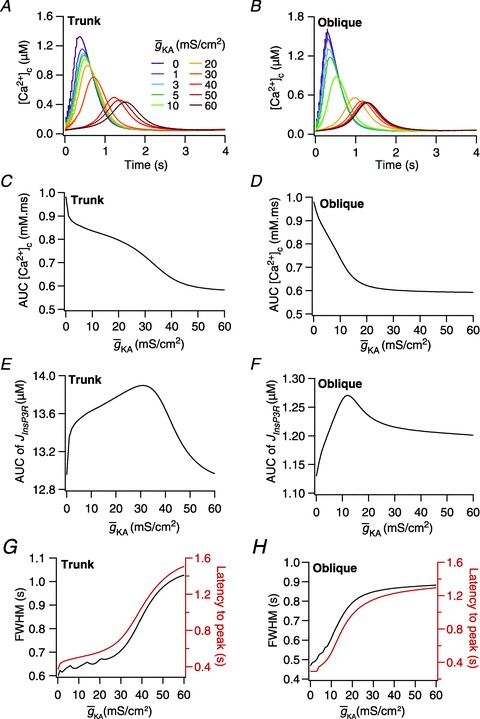
Figure 5. In a morphologically realistic model, A-type K+ channels altered the amplitude, width and latency of Ca2+ waves through regulation of both intrinsic excitability and release of Ca2+ from the stores.

A and B, [Ca2+]c traces plotted for various A-type K+ channel densities ( ), at representative trunk (A) and proximal oblique (B) locations. C and D, area under the curve (AUC) for total [Ca2+]c plotted as a function of
  , at representative trunk (C) and proximal oblique (D) locations. E and F, AUC for the Ca2+ flux through InsP3 receptors (
 ) plotted as a function of
  , at representative trunk (E) and proximal oblique (F) locations. G and H, temporal aspects of the Ca2+ wave quantified as the wave's full-width at half-maximum (FWHM) and latency to peak, and plotted as functions of
  , at representative trunk (A) and proximal oblique (B) locations. Trunk: location on the apical trunk 77 μm (radial distance) from the soma; Oblique: location on Oblique 1 (Fig. 4G) 17 μm (path distance) away from the branch point on the trunk. For A–H
 represents the value of A-type K+ channel densities at the soma while the individual compartments had local
  according to eqn (3) along the neuronal topograph.
