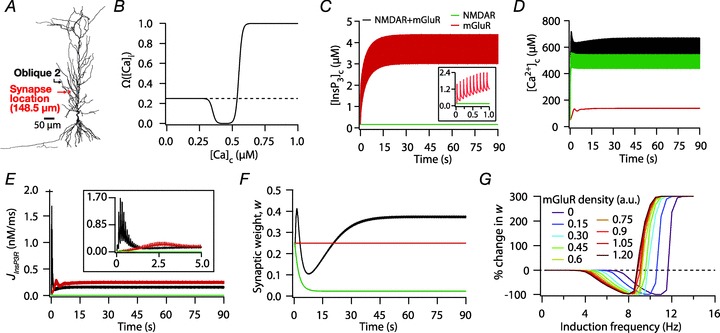
Figure 6. Increase in mGluR density induced a saturating leftward shift to a BCM-like synaptic plasticity profile.

A, projection of the three-dimensional neuronal reconstruction depicting the location of the synapse where all plasticity experiments were performed. The circle in the middle of Oblique 2 (arrow), located at 148.5 μm away from the trunk branch point represents the synaptic location. B, functional form of the plasticity-regulating function,  (eqn (43)), plotted for various concentrations of [Ca2+]c. C–F, evolution of local [InsP3]c (C), local [Ca2+]c (D), local Ca2+ flux through InsP3 receptors,
  (E), and normalized synaptic weight, w (F), when a synapse was stimulated by 900 presynaptic action potentials at 10 Hz, shown for cases where the synapse contained only mGluRs or only NMDARs or both mGluRs and NMDARs. Note that the trace obtained in the presence of only mGluRs and the trace obtained in the presence of both mGluRs and NMDARs are overlapping in C. Insets in C and E show the same plots in C and E, expanded over the first 1 and 5 s of the induction protocol, respectively. G, synaptic plasticity profile across various induction frequencies (900 pulses), shown for various densities of mGluRs in the synaptic compartment.
