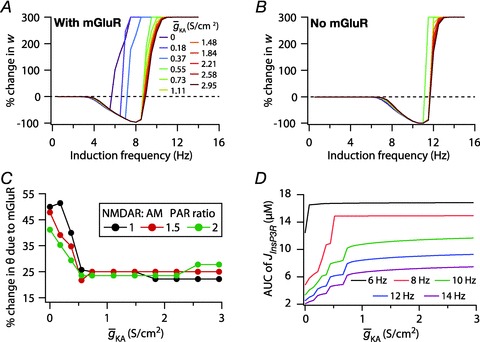
Figure 7. Interplay between the InsP3Rs and the A-type K+ channels in regulating the modification threshold in a BCM-like synaptic plasticity model.

A and B, synaptic plasticity profile across various induction frequencies (900 pulses), shown for various densities of the A-type K+ channel ( ) in the synaptic compartment, in the presence (A, density = 1.2 a.u.) and the absence (B) of mGluR. C, percentage change in θ due to mGluR, calculated as 100 × (θmGluR – θnomGluR)/θnomGluR (obtained from experiments shown in A and B), plotted as a function of
  . The different plots correspond to simulations performed with different values for the NAR, to assess the relative contribution of NMDAR and mGluR to plasticity. D, area under the curve (AUC) of
  through the 900 pulses protocol plotted as a function of
  at various induction frequencies employed, for saturating mGluR density (= 1.2 × 10⁻³ a.u.) at 1.5 NAR. AMPAR densities remained the same across these simulations.
