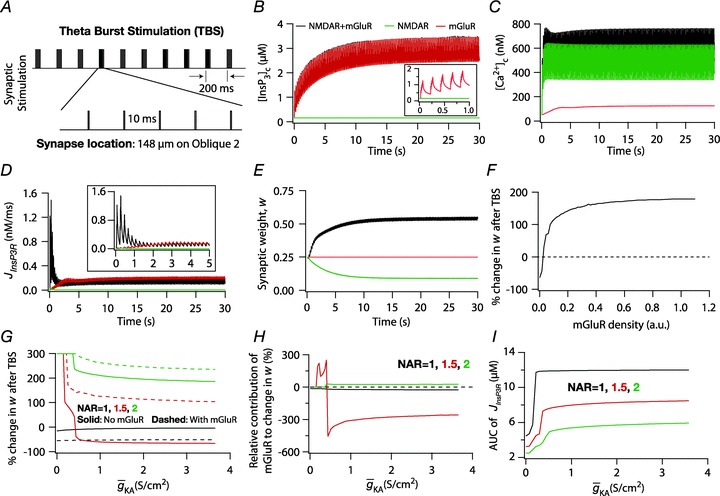
Figure 8. Interplay between the InsP3Rs and the A-type K+ channels in regulating synaptic plasticity induced through TBS.

A, protocol employed for induction of synaptic plasticity through TBS. Ten bursts are shown, with each burst made of five stimuli separated by 10 ms, and interburst interval set at 200 ms. Synaptic location was the same as depicted in Fig. 6A. B–E, evolution of local [InsP3]c (B), local [Ca2+]c (C), local Ca2+ flux through InsP3 receptors,  (D), and normalized synaptic weight, w (E), when a synapse was stimulated by TBS, shown for cases where the synapse contained only mGluRs or only NMDARs or both mGluRs and NMDARs. Note that the trace obtained in the presence of only mGluRs and the trace obtained in the presence of both mGluRs and NMDARs are overlapping in B. Insets in B and D show the same plots in B and D, expanded over the first 1 and 5 s of the induction protocol, respectively. F, steady state change in synaptic weight after TBS, shown for various densities of mGluRs in the synaptic compartment. G, Steady-state change in synaptic weight after TBS, plotted as a function of the A-type K+ conductance density (
 ) for different values of NMDAR:AMPAR ratio (NAR), in the presence and absence of mGluRs. H, percentage change in synaptic weight due to mGluR, calculated as 100 × (Δ%wmGluR
– Δ%wnomGluR)/Δ%wnomGluR (obtained from experiments shown in G), plotted as a function of
  . The different plots correspond to simulations performed with different values for the NAR, to assess the relative contribution of NMDAR and mGluR to plasticity. I, area under the curve (AUC) of
  through the TBS protocol plotted as a function of
  , for various values of NAR at saturating concentration of mGluR (= 1.1 × 10⁻³ a.u.). AMPAR densities remained the same across these simulations.
