
Figure 6. Effects of nanomolar ouabain on Ca2+ signals in axons and dendrites.
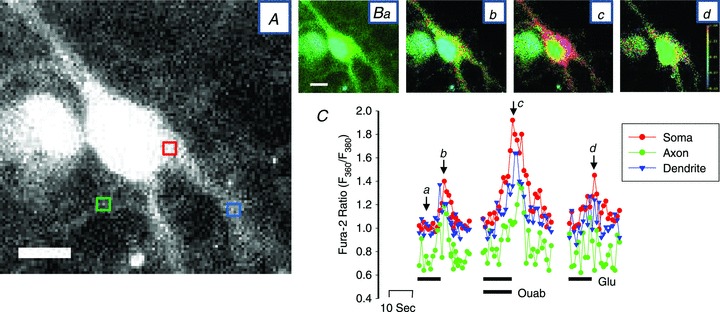
A, enlarged fura-2 (F380) image of a neurone showing the areas from which the time course data in C were obtained; the soma (red box), the axon (green box) and a dendrite (blue box) are indicated. The contrast was enhanced in this image to help visualize the axon. B, F360/F380 ratio images obtained in basal conditions (Ba), at the peak of the first response to 3 μm Glu (Bb), at the peak of the response to 3 nm ouabain + 3 μm Glu (Bc) and at the peak of the response to Glu after washout of ouabain (Bd). C, time course of the Ca2+ transients (F360/F380 ratios) recorded within the red, green and blue boxes in A (soma, axon and dendrite, respectively). The protocol was the same as that used in Fig. 5Aa; only the periods before, during and after the Glu-evoked transients are shown. Lettered arrows indicate the times at which images Ba–d were recorded. This neurone is representative of more than 10 neurones in which this type of analysis was performed. Similar results were obtained with digoxin (e.g. in the neurone indicated by the arrow in the inset in Fig. 5Aa). Calibration bars in A and Ba represent 20 μm.