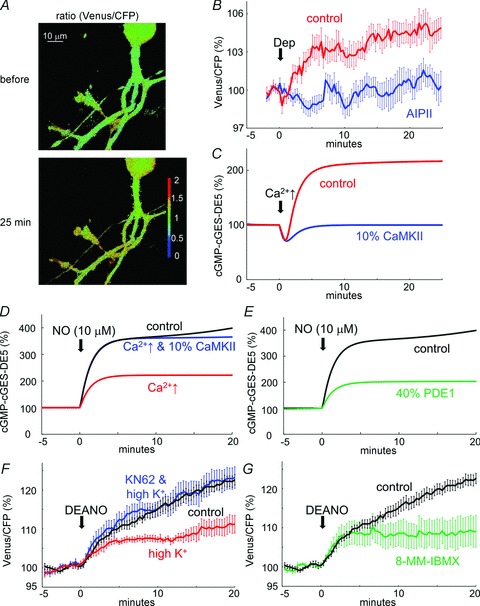
Figure 8. Imaging of CaMKII-dependent sustained increase of cGMP in a Purkinje cell.

A and B, representative images (A) and time courses (B) of fluorescence ratio (Venus/CFP) before and after the conditioning depolarization of a cultured Purkinje cell with or without AIPII. n = 10 for each. C, simulated time courses of cGMP-bound cGES-DE5 probe protein amount before and after the conditioning Ca2+ increase (2 μm for 10 s) with or without reduction of CaMKII amount. D and E, simulated time courses of change of cGMP-bound cGES-DE5 probe in response to NO stimulation without or with CaMKII reduction to 10%. Prior transient Ca2+ stimulation was applied (D) or the amount of PDE1 was reduced to 40% in advance (E) in the model. F and G, time courses of FRET efficiency changes upon DEANO application to a Purkinje cell with or without prior high K+ treatment in the presence or absence of KN62 (F) or pretreatment with 8-MM-IBMX (G). n = 8 for each.
