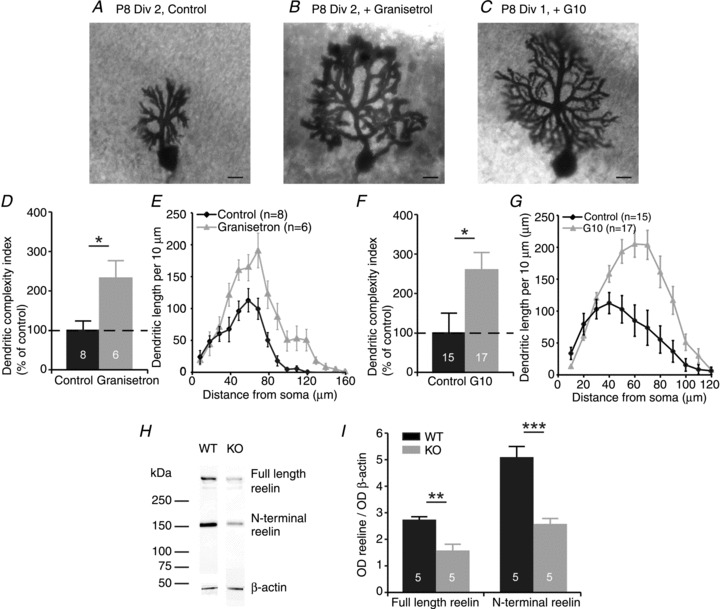
Figure 2. Organotypic slice cultures show that morphological maturation of Purkinje cells is regulated by 5-HT3 receptors via the glycoprotein reelin.

A, example of a P8 Purkinje cell in control conditions after 2 days in culture (Div). B, example of a P8 Purkinje cell after 2 days in culture with 100 nm granisetron, a selective 5-HT3 receptor antagonist. C, example of a P8 Purkinje cell after 2 days in culture with G10, an antibody against the N-terminal of reelin. Scale bars in A–C indicate 10 μm. D, the dendritic complexity index of Purkinje cells from cerebellar slices cultured at P8 after 2 days in culture shows an increased complexity of the Purkinje cells treated during the culture period with granisetron. E, Sholl analysis indicates an increase in dendritic length in granisetron-treated Purkinje cells in the area 60–130 μm from the soma. F, the dendritic complexity index from Purkinje cells from cerebellar slices cultured at P8 after 1 day in culture shows an increased complexity of the Purkinje cells treated during the culture period with G10. G, Sholl analysis shows an increase in dendritic length between 40 and 100 μm from the soma in the culture conditions with G10. H, Western blots for whole-cerebellum homogenates from P9 WT and 5-HT3A receptor knockout mice showing protein bands for full-length reelin, the N-terminal of reelin, and β-actin. I, quantification of Western blot analysis indicates that the level of optical density (OD) of reelin is reduced in 5-HT3A receptor knockout mice at P9. The numbers in the bars of the graphs indicate the number of cells used for analysis.
