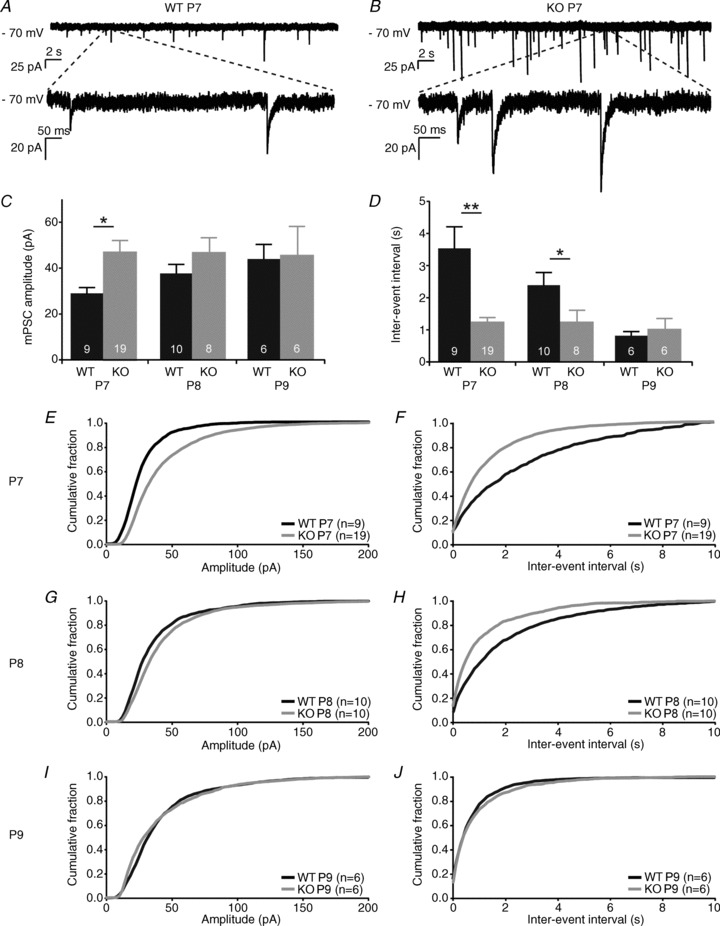
Figure 5. Increased frequency and amplitude of spontaneous miniature postsynaptic currents in Purkinje cells from 1-week-old 5-HT3A receptor knockout mice.

A, example trace of spontaneous miniature postsynaptic currents (mPSCs) recorded at −70 mV from Purkinje cells in P7 WT mice. B, similar example trace in P7 5-HT3A receptor knockout mice. C, amplitudes of mPSCs in Purkinje cells from WT and 5-HT3A receptor knockout mice indicate a significant difference at P7, but not at P8. D, average interevent intervals of the mPSCs recorded from Purkinje cells in WT and 5-HT3A receptor knockout mice indicate a difference at P7 and P8, but not at P9. E, G and I, amplitude distributions of mPSCs recorded from Purkinje cells show a significant difference between WT and 5-HT3A receptor knockout mice at P7. F, H and J, interevent interval distributions of mPSCs recorded from Purkinje cells show a significant difference between WT and 5-HT3A receptor knockout mice at P7 and P8. The numbers in the bars of the graphs indicate the number of cells used for analysis.
