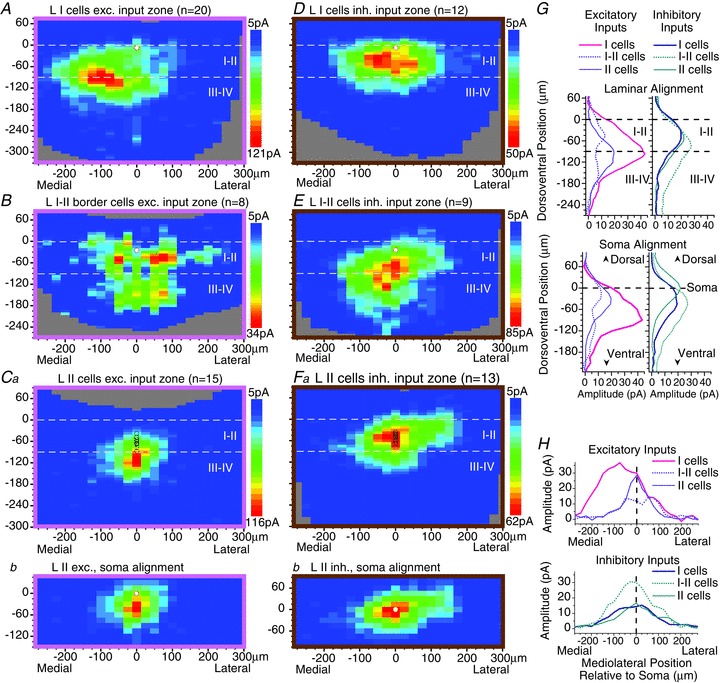
Figure 2.

A–F, averaged transverse maps of excitatory (A–C) and inhibitory (D–F) synaptic input zones for lamina I cells (A and D), ‘lamina I–II border’ cells (B and E) and lamina II cells (C and F). The ‘I–II border’ cells are located in a very restricted zone in the outermost part of lamina II, essentially one cell layer in width, with the dorsal edge of their soma touching or nearly touching the inner border of lamina I. For the lamina I cells and the laminae I–II border cells, the soma locations of each of these two populations are confined within a very narrow dorsoventral range, and so the soma locations of the recorded (postsynaptic) neurons in each map are marked by a single white circle (A, B, D and E). However, the sample of lamina II neurons is spread over a much larger dorsoventral range, and so the soma location of each neuron in the sample is marked individually with circles (Ca and Fa). In addition, a separate set of ‘soma-aligned’ averaged maps is shown for the lamina II neurons (Cb and Fb), in which the maps of the individual neurons were aligned dorsoventrally by soma location rather than by laminar borders (same colour scales as in Ca and Fa, respectively). G and H, plots of the dorsoventral (G) or mediolateral (H) distribution of synaptic response amplitudes for each of the averaged maps shown in A–F. In G, plots are shown with dorsoventral alignment by laminar borders (upper plots) and by soma position (lower plots).
