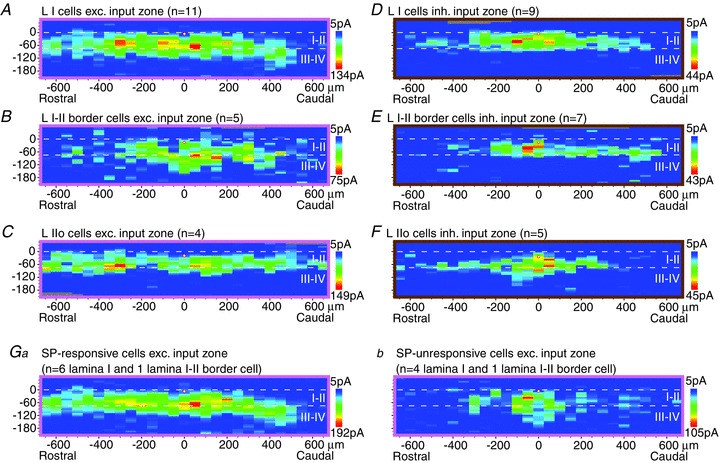
Figure 6.

A–F, averaged parasagittal maps of excitatory (A–C) and inhibitory (D–F) synaptic input zones for lamina I cells (A and D), lamina I–II border cells (B and E) and lamina IIo cells (C and F). As in the transverse sample (Fig. 2), the I–II border cells are about one cell diameter below the white matter. The small sample of IIo cells in this figure is restricted to the outermost part of lamina II, just slightly below the I–II border cells (about one cell diameter below the I–II border), and so is not comparable to the larger and dorsoventrally more extensive sample of lamina II cells collected in transverse slices (Fig. 2C and F). Ga,b, averaged excitatory synaptic input zones of cells responsive and unresponsive to substance P (SP), respectively; only lamina I and lamina I–II border cells are included. Note that the parasagittal maps have a smaller scale than the transverse maps (Fig. 2).
