
Figure 1. Concentration–response relationships of chorda tympani (CT) nerve responses for umami taste stimuli.
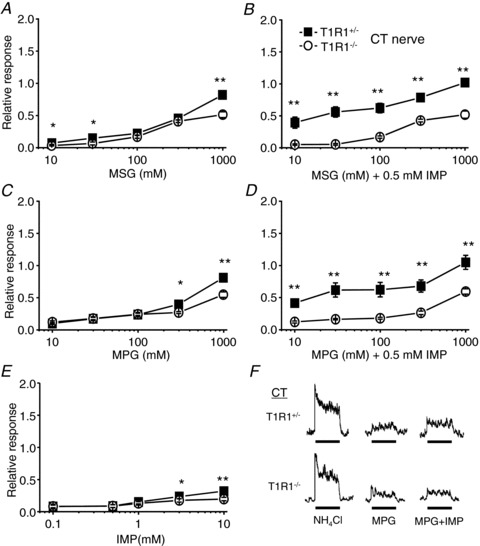
Responses to monosodium glutamate (MSG; A), MSG + 0.5 mm inosine monophosphate (IMP; B), monopotassium glutamate (MPG; C), MPG + 0.5 mm IMP (D) and IMP (E) in T1R1+/− (filled rectangles; n= 5–10) and T1R1−/− mice (open circles; n= 5–16) are shown. Chorda tympani nerve responses were normalized to the response to 100 mm NH4Cl. Values indicated are means ± SEM. Statistical differences were analysed by two-way ANOVA tests (see Table 2) and Student's t test (*P < 0.05, **P < 0.01). F, sample recordings of CT nerve responses to 100 mm NH4Cl, 100 mm MPG and 100 mm MPG + 0.5 mm IMP in T1R1+/− (top traces) and T1R1−/− mice (bottom traces). Bars indicate taste stimulation (30 s).