
Figure 2. Concentration–response relationships of glossopharyngeal (GL) nerve responses for umami taste stimuli.
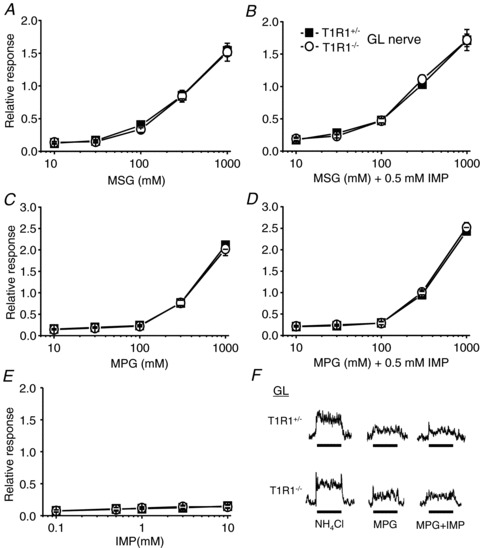
Responses to MSG (A), MSG + 0.5 mm IMP (B), MPG (C), MPG + 0.5 mm IMP (D) and IMP (E) in T1R1+/− (filled rectangles; n= 5–13) and T1R1−/− mice (open circles; n= 5–14) are shown. Glossopharyngeal nerve responses were normalized to the response to 100 mm NH4Cl. Values indicated are means ± SEM. There were no statistically significant differences in two-way ANOVA tests (see Table 2). F, sample recordings of GL nerve responses to 100 mm NH4Cl, 100 mm MPG and 100 mm MPG + 0.5 mm IMP in T1R1+/− (top traces) and T1R1−/− mice (bottom traces). Bars indicate taste stimulation (60 s).