
Figure 7. Gene expression analysis of mCherry-expressing cells in fungiform papillae of T1R1+/− and T1R1−/− mice by single-cell RT-PCR.
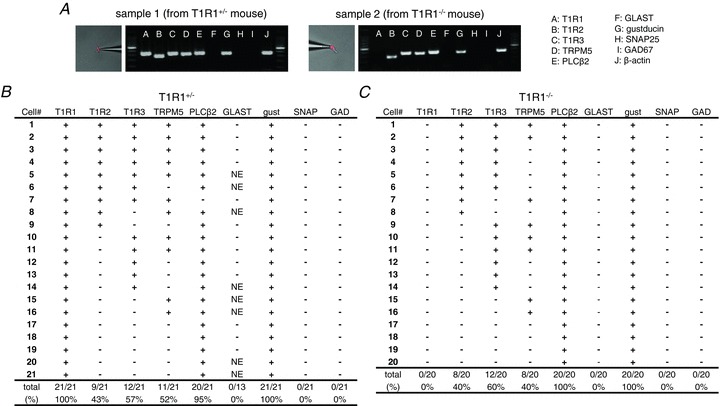
A, examples of single-cell RT-PCR from typical profiled cells. After harvesting single mCherry-expressing taste cells (left pictures), gene expression was analysed by multiplex single-cell RT-PCR (right pictures). Positive and negative control reactions were always run in parallel with reactions with samples (Fig. S1). B and C, summarized data from 21 and 20 mCherry-expressing cells in T1R1+/− (B) and T1R1−/− mice (C), respectively. Each row represents a single cell, and each column represents a different gene as indicated. A plus sign denotes that RT-PCR product was detected, and a minus sign denotes the lack of expression. NE denotes that expression was not examined.