
Figure 1. Glutamate release from the primary afferent terminals in neuropathic rats was increased in comparison with sham-operated rats.
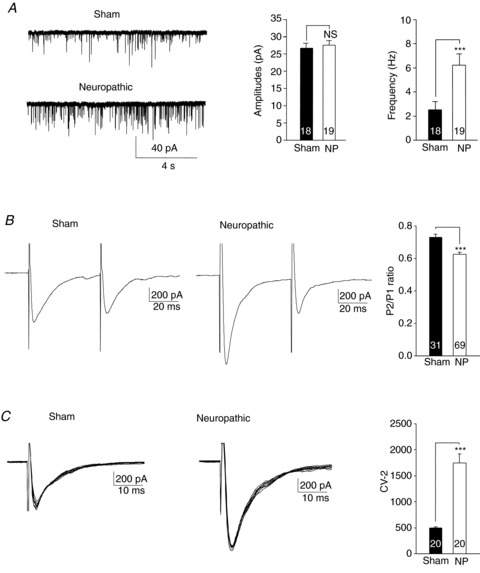
A, samples of mEPSC recordings recorded from sham-operated (Sham) and neuropathic rats. Bar graphs show comparisons of mean (+SEM) amplitudes (left) and frequencies (right) of mEPSCs between sham-operated and neuropathic rats. B, samples of EPSCs evoked by a pair of electrical pulses applied to the spinal dorsal root in a neuron from sham-operated rats and neuropathic rats. Bar graphs show the mean (+SEM) P2/P1 ratios in sham-operated and neuropathic rats. The ratio of the second peak amplitude (P2) over the first peak amplitude (P1) was lower in neuropathic rats than in sham-operated rats. C, samples of variability of 10 evoked EPSCs collected from a neuron of sham-operated rats and neuropathic rats. Bar graphs show the mean (+SEM) CV−2 values in sham-operated and neuropathic rats. The inverse squared coefficient of variation (CV−2) was larger in neuropathic rats than that in sham-operated rats. Number of neurons included in each group for the analysis is shown in each bar. * indicates comparison between sham-operated (Sham) and neuropathic (NP) rats. ***P < 0.001; NS, no statistical significance.