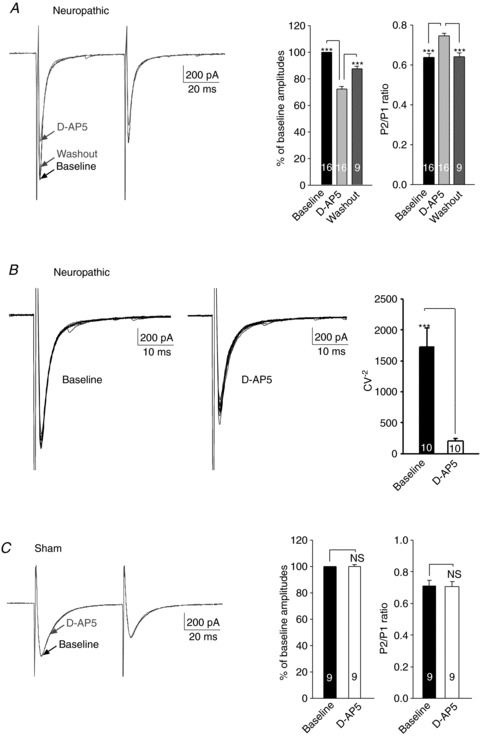
Figure 3. Endogenous activation of presynaptic NMDARs increased glutamate release from the presynaptic terminals in the first sensory synapse in the spinal dorsal horn of neuropathic rats but not in sham-operated rats.

A, samples of EPSCs evoked by a pair of electrical pulses recorded from a neuron of neuropathic rats before (baseline), during and after washout of d-AP5 (25 μm). Bar graphs (right) show the mean (+SEM) amplitudes and P2/P1 ratios before, during, and after washout of d-AP5. Bath application of d-AP5 significantly and reversibly reduced the first peak amplitudes but increased the P2/P1 ratio. B, samples of variability of 10 evoked EPSCs collected from a neuron of neuropathic rats before (left) and during perfusion of d-AP5 (25 μm) are shown. The mean (+SEM) CV−2 values before and during perfusion of d-AP5 are shown in bar graphs (right). d-AP5 significantly increased the variability of evoked EPSCs. C, samples of EPSCs evoked by a pair of electrical pulses recorded from a neuron of sham-operated rats before (baseline) and during perfusion of d-AP5 (25 μm). Bar graphs (right) show the mean (+SEM) amplitudes and P2/P1 ratios before and during perfusion of d-AP5. Bath application of d-AP5 did not alter the first peak amplitudes or the P2/P1 ratio. ***P < 0.001; NS, no statistical significance.
