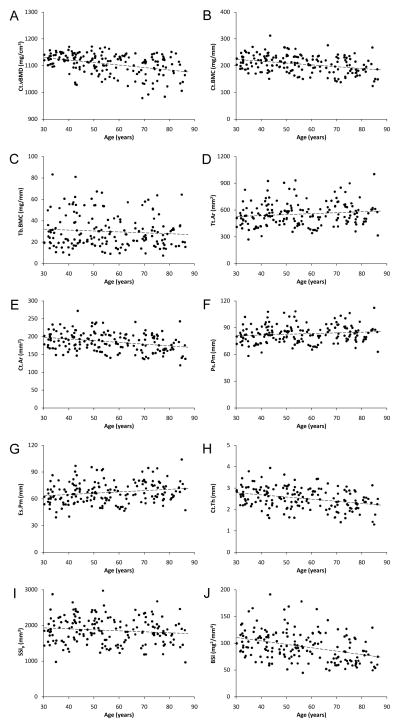
Figure 4.
Scatterplots illustrating the relationship between age and pQCT measures of proximal humerus: A) cortical volumetric BMD [Ct.vBMD], B) cortical BMC [Ct.BMC], C) trabecular BMC [Tb.BMC], D) total area [Tt.Ar], E) cortical area [Ct.Ar], F) periosteal perimeter [Ps.Pm], G) endosteal perimeter [Es.Pm]; H) cortical thickness [Ct.Th], I) polar strength-strain index [SSIP], and J) bone strength index [BSI]. Curve fitting revealed age and pQCT measures of proximal humerus bone health were linearly related, as opposed to quadratic, cubic, exponential or logarithmic.

