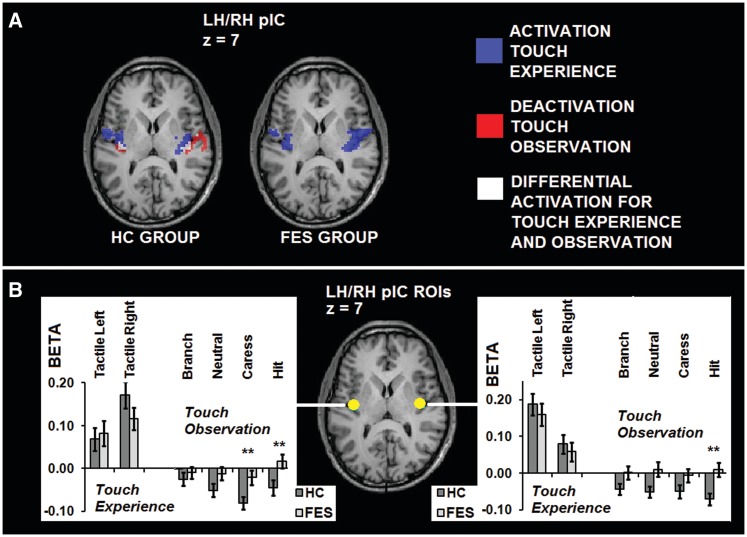
Fig. 2.
(A) Conjunction analysis. Group statistical maps (P < 0.05 corrected) of the HC and FES group depicting positive BOLD modulation clusters for the tactile simulation task (blue), negative BOLD modulation for the social perception task (red; absent in FES) and significant differential activation patterns for touch experience and observation (white; absent in FES) in pIC. (B) ROI-based analysis. Graphs showing activation patterns (β-values) for the different touch experience and observation conditions in the ROIs in pIC, and between-group differences (**P < 0.01).

