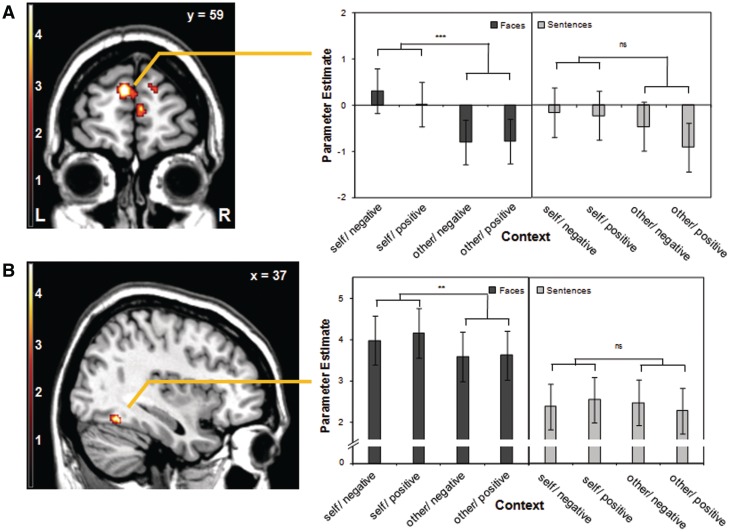
Fig. 2.
Brain activity for the contrast self-related vs other-related (whole-brain analysis, P < 0.005, uncorrected, k = 10 contiguous voxels) and parameter estimates extracted from a sphere (r = 5 mm) centered on the respective peak voxel. (A) Increased activity in the medial prefrontal cortex (mPFC; x = −6, y = 62, z = 22). (B) Increased activity in the right fusiform gyrus (x = 34, y = −58, z = −16). Error bars represent 95% within-subject confidence intervals (CIs). ***P < 0.001, **P < 0.005.

