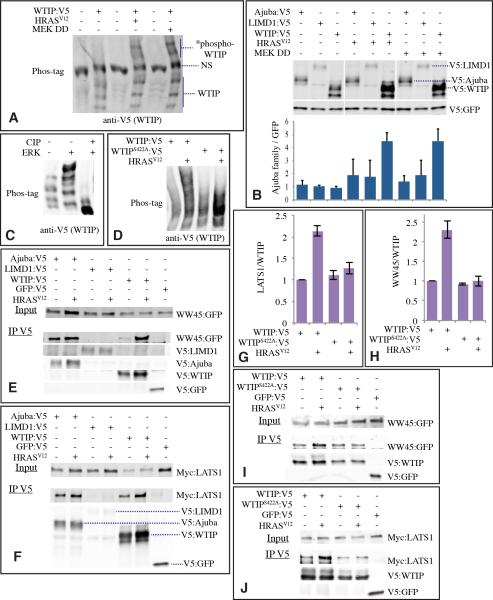
Figure 7. Regulation of WTIP by EGFR-RAS-MAPK signaling.
A) Increased WTIP phosphorylation (*phospho-WTIP) by Ras-MAPK signaling. Western blot on lysates of cells co-transfected to express WTIP:V5, HRasV12 or MEK DD, as indicated. Lysates were run on a Phos-tag gel, and probed with anti-V5. NS denotes non-specific band. B) Stabilization of Ajuba family proteins by RAS-MAPK signaling. Cells were transfected to express GFP:V5, and, as indicated, Ajuba:V5, LIMD1:V5, WTIP:V5, HRasV12 or MEK DD (activated MEK). Cell lysates were probed with anti-V5. Histogram, representing average results from 3 independent experiments, quantifies Ajuba family protein levels normalized to GFP, only for effects of activated RAS or MEK on WTIP were differences statistically significant by t test, error bars indicate s.d. C) Western blot (anti-V5) on affinity-purified V5-tagged WTIP, subject to in vitro kinase reaction using ERK, phosphatase treatment using CIP, where indicated, and then separated on Phos-tag gels. D) Western blot (anti-V5) on samples from U87MG cells transfected to express WTIP:V5, WTIPS422A:V5 and HRASV12 as indicated. Samples were run on a 7% phos-tag gel. E) Ajuba family protein binding to WW45. Cells co-transfected with WW45:GFP and, as indicated, Ajuba:V5, LIMD1:V5, WTIP:V5, GFP:V5, or HRasV12 were probed with anti-GFP (upper panel). Lower panels show blots on material precipitated by anti-V5 beads. F) Ajuba family protein binding to Lats1. Cells co-transfected with Myc:LATS1 and, as indicated, Ajuba:V5, LIMD1:V5, WTIP:V5, GFP:V5, or HRasV12 were probed with anti-Myc (upper panel). Lower panels show blots on material precipitated by anti-V5 beads. G) Histogram, representing average results from 3-5 independent experiments, quantifies LATS1 binding to WTIP normalized to the average ratio in control experiments. error bars show s.e.m. H) Histogram, representing average results from 3-5 independent experiments, quantifies WW45 binding to WTIP normalized to the average ratio in control experiments. error bars show s.e.m. I,J) Western blots showing representative examples of the influence of WTIPS422A mutation on the ability of activated RAS to influence binding of WTIP to WW45 (I) and (LATS1 (J), experiments were otherwise identical to those shown in E and F.

