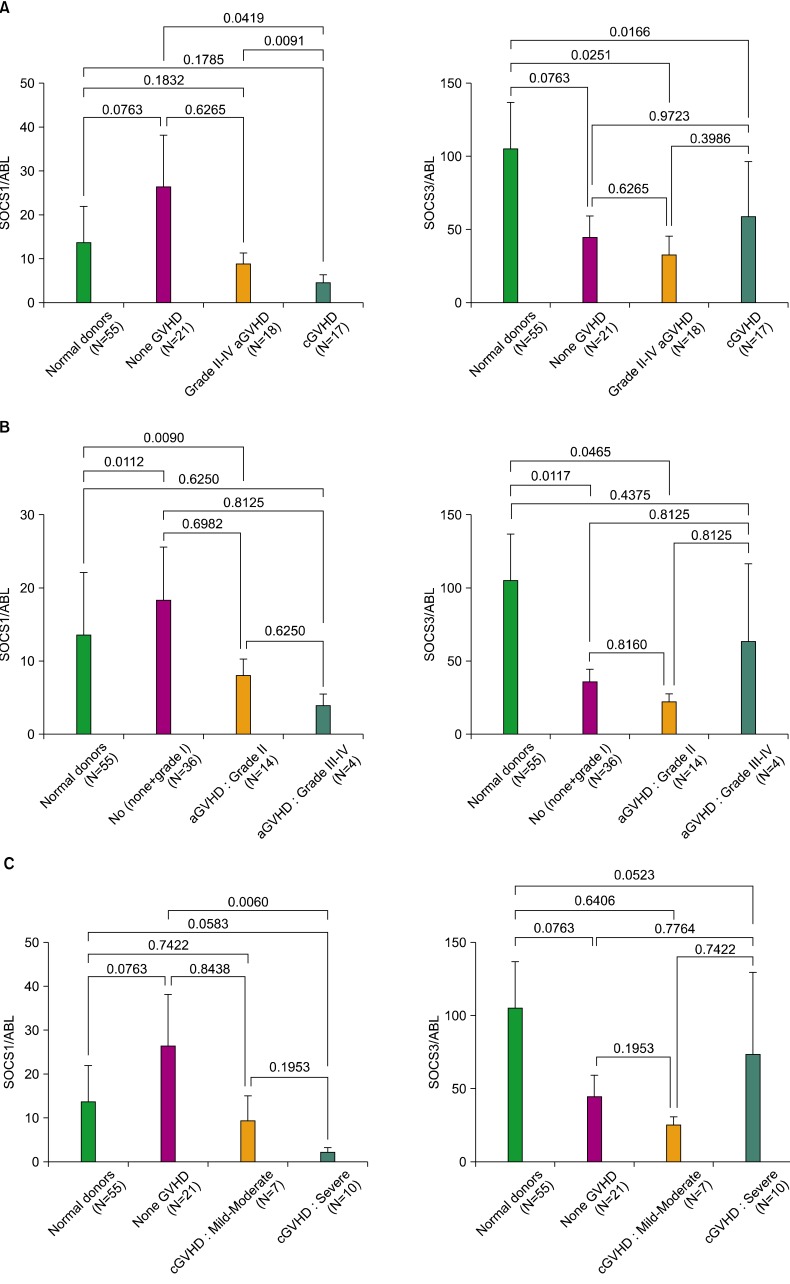
Fig. 1.
Comparison of SOCS genes in normal donors and GVHD recipients post HSCT. Mononuclear cells (MNCs) from recipients were isolated and subjected to qRT-PCR. (A, left) Data showed that the none-GVHD group (N=21) exhibited a significantly higher level of SOCS1 expression compared to the cGVHD group (N=17). (A, right) SOCS3 expression levels were low in the grade II-IV aGVHD (N=18), cGVHD, and none-GVHD groups compared to normal donors (N=55). (B) SOCS1 and SOCS3 expression levels in grade II aGVHD (N=14) differed significantly compared to those in normal donors. (C, left) SOCS1 expression differed significantly between the severe cGVHD (N=10) and the none-GVHD groups. (C, right) SOCS3 expression was lower in the mild-moderate cGVHD (N=7) group than in the none-GVHD and severe cGVHD groups. P values in (A-C) indicate significant differences relative to each comparison group.

