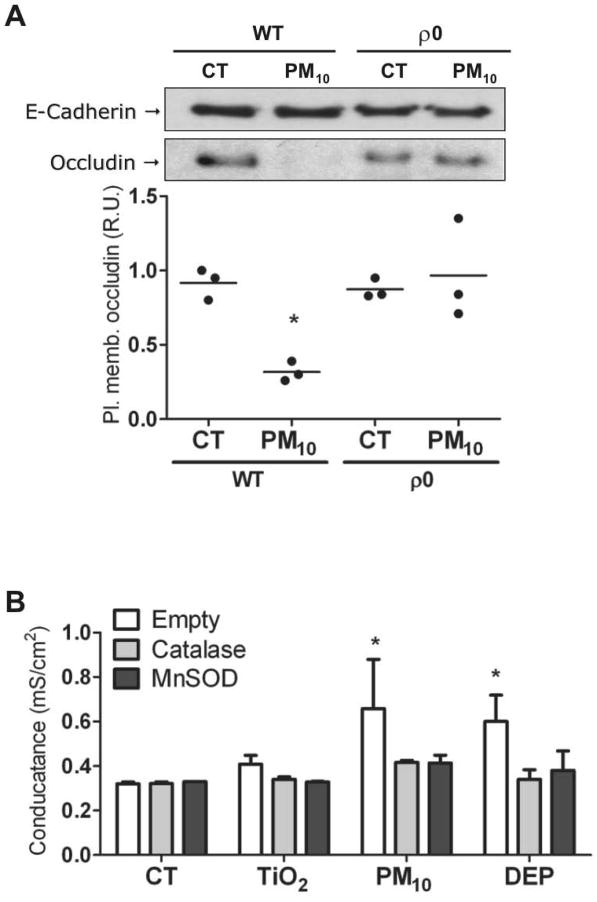
Figure 4. Mitochondrial ROS mediate PM-inducedGt increase and occludin reduction in AEC.
Panel A. WT and ρ0 human AEC were treated with PM10 (20μg/cm2) for 3h, then, surface proteins were labeled with biotin and pulled down with streptavidin beads and analyzed by WB. Panel B. Primary rat AEC were infected with adenovirus containing Catalase and MnSOD plasmids, 24h after infection, cells were treated with 20μg/cm2 of TiO2, PM10 or DEP for 3h and Gt were measured. Shown are representative blots and quantitative analysis of three independent experiments. Graph A represents mean with dots representing individual experiments and Graph B represents mean ± SEM (n=3). * p<0.05 when compared with control.

