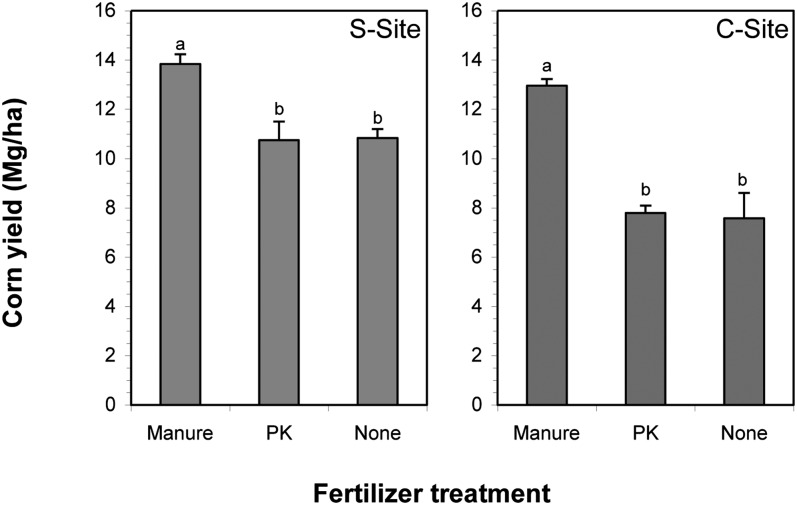
Fig. 3.
Fertilizer treatment effect on corn in the SCN-suppressive (S-Site) and -conducive (C-Site) sites in 2009. The bars are mean values of four replicates, and the lines on bars indicate the standard error. Significant differences among the different fertilizer treatments within the same graph are indicated by different letters above the bars according to least significance difference test at P < 0.05.

