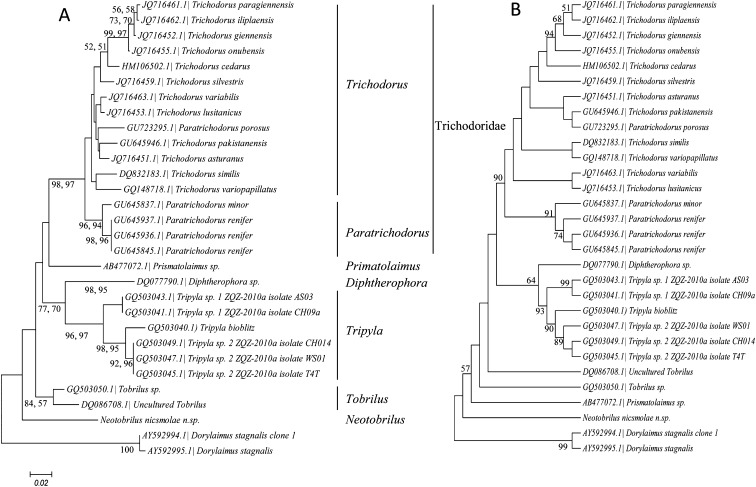
Fig. 6.
Phylogram of Triplonchida showing relationship of Neotorbilus and Tobrilidae. (A) Neighbor-joining and maximum likelihood phylogram. Bootstrap values on branches represent (from left to right) neighbor-joining and maximum likelihood, respectively. (B) Maximum parsimony phylogram. Both trees are based on Clustal W alignment of the D2D3 expansion segment with 1,000 bootstrap value repetitions using the Tamura-Nei model.

